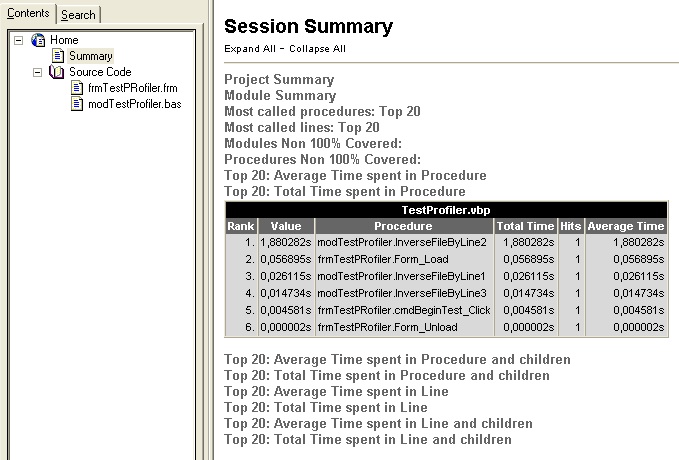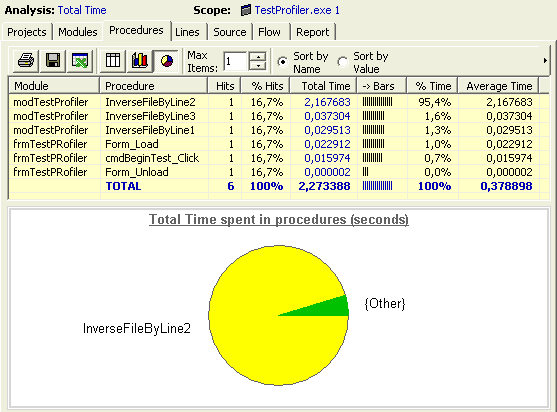
The VB Watch Profiler analyzes the performance data gathered during the execution of your application, compiled or not. It can analyze different sessions of a single project or a project group, compare them or even merge them into a global session. It can produce a full html or chm report, or even export data in Microsoft Excel or any other application of your choice.
Time profiler
The time profiler is used to see how much time is spent in each function and each line of your code.

The profiler includes an easy-to-use browsing system, allowing you to navigate quickly through projects, modules, procedures and lines of code until you find the desired information. Within a few clicks it will take you to the slowest lines of code, showing exactly the time spent in it.
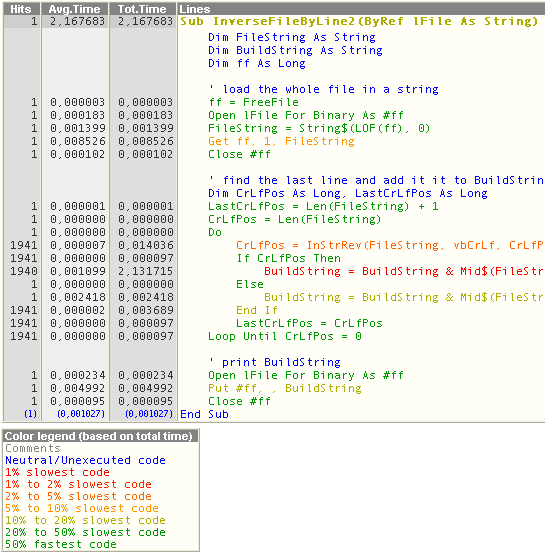
The source code view is a powerful tool for analyzing your code's performance.
Coverage profiler
With just one click, you jump to the coverage view. Easily identify portions of code that were never executed and that are likely to contain errors.
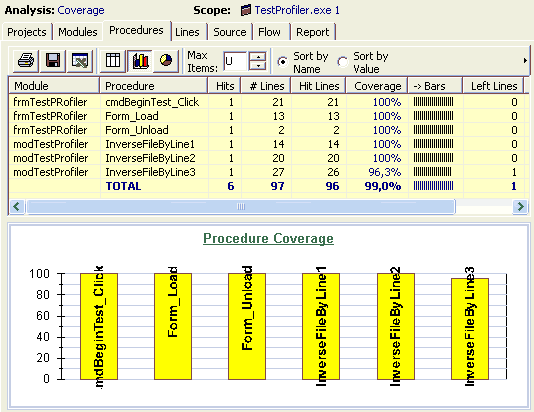
Don't ship code before it is 100% executed !
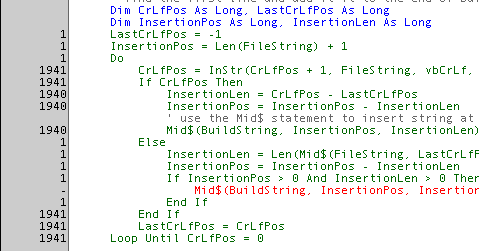
The line in red was never executed. The left margin displays the number of time each line was executed.
Additional features
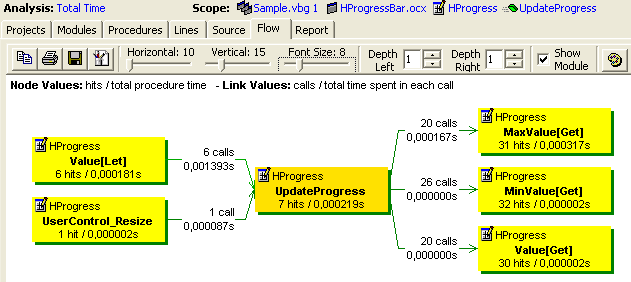
See the dynamic call graph of your application.
The profiler includes now a powerful report feature to produce full .chm reports (see below) or export all data in excel for deeper analysis or macro processing.
